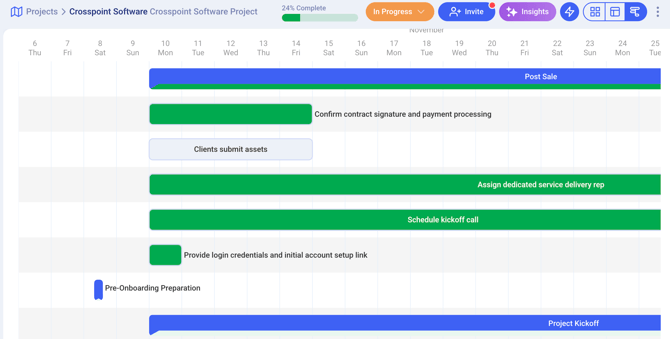
Gantt Chart View
View your Project in a timeline view via a Gantt Chart

Onboard Projects can be viewed in a timeline view by utilizing a powerful tool called a Gantt Chart. This feature allows you to visually represent your projects in a way that showcases the chronological order of tasks and events. By using a Gantt Chart, you can easily track and manage the progress of your Project tasks, ensuring that everything is on schedule and deadlines are met.
💡 Pro tip: The Gantt chart view is incredibly valuable when you have due dates and estimated times for all your Global Tasks.
The Gantt Chart also provides a comprehensive overview of the project, displaying important milestones and deadlines. This allows you to track the progress of each task and ensure that they are completed within each section and before the target launch date.
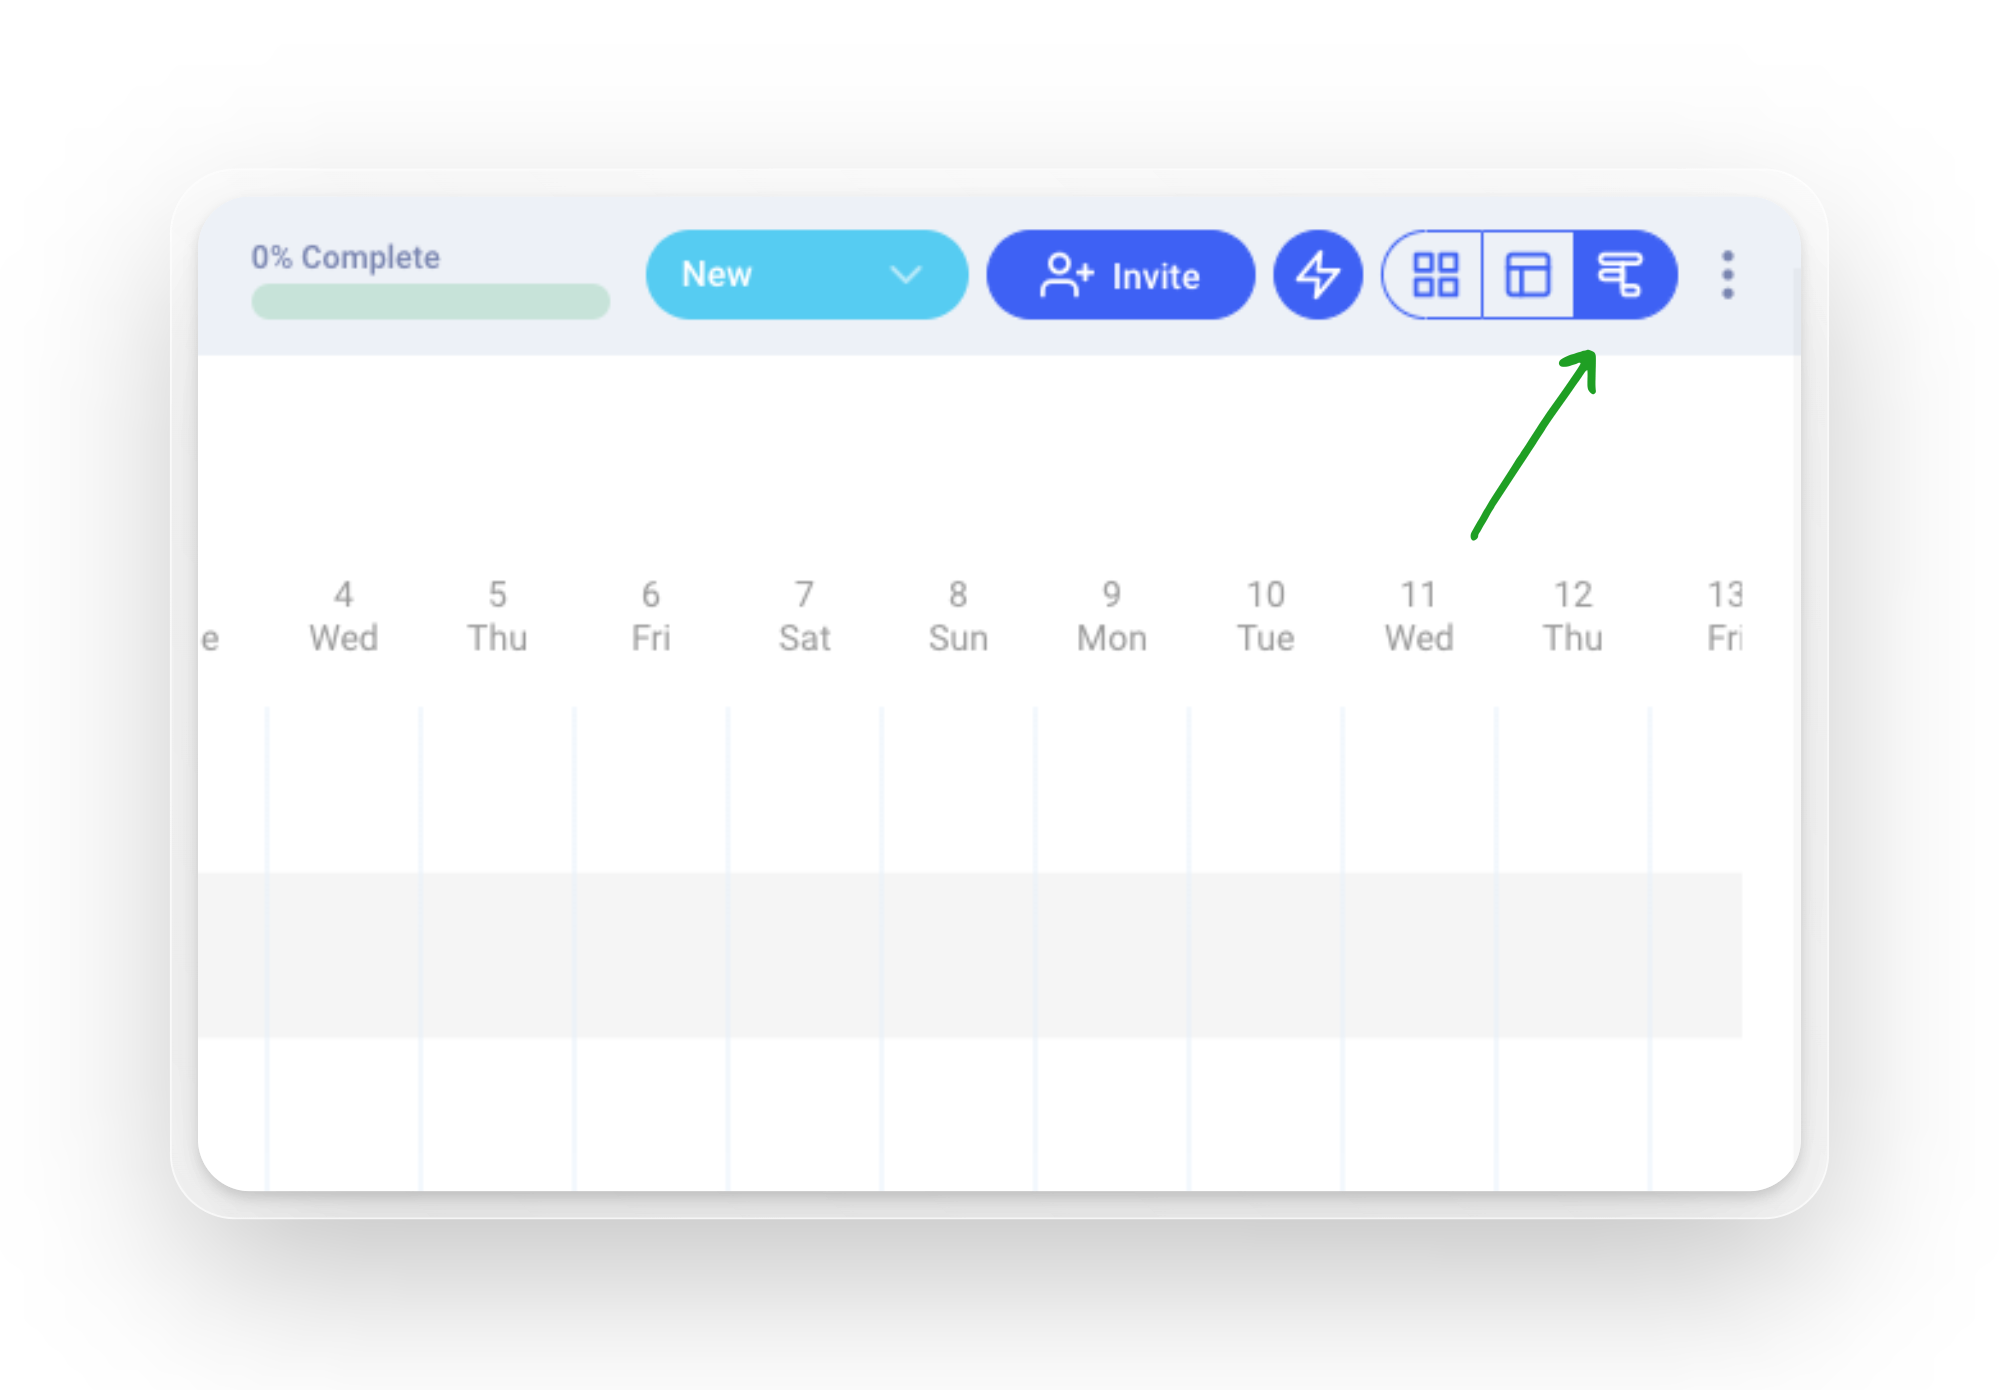
How can I access the Gantt Chart View?
- Go to a Project
- Click on the Gantt chart button in the view switcher

How does the Gantt chart generate the initial dates?
When a Project is generated, the Gantt will generate default start and end dates for all the tasks.
- Sections will have a start date of the earliest date in the section, and and end date of the last due date in the section
- If a task has a specified due date, the end date in the Gantt chart will correspond to that.
- If a task has an estimated time set, the Gantt chart will display the task's start date as a number of days before the due date.
- For tasks that have a duration of multiple days, the Gantt chart considers only weekdays when calculating the date range. For example, if a task is due on Monday and it takes 3 days to complete, the Gantt chart will show the task spanning from the previous Thursday to Monday.
- The default duration of a task is set to one day, unless otherwise specified.